Key figures
Company and governance
Results of operations, assets, and financial position
€ million
Change in %
| 2024 | 2023 | 2022 | 2021 | 2024/23 |
|---|---|---|---|---|---|
Group revenue | 1,621.4 | 1,373.3 | 1,188.0 | 601.3 | 18.1 |
EBITDA | 398.1 | 317.7 | 238.7 | –45.8 | |
EBIT | 194.9 | 114.9 | –27.7 | –285.7 | |
Consolidated earnings after taxes | 64.4 | 25.4 | –58.8 | –261.3 | |
EBITDA margin in % | 24.6 | 23.1 | 20.1 | –7.6 |
|
EBITDA/Pax in € | 9.6 | 8.6 | 7.5 | –3.7 |
|
EBIT margin in % | 12.0 | 8.4 | –2.3 | –47.5 |
|
ROCE1) in % | 4.0 | 2.4 | –0.6 | –6.0 |
|
Cash flow from operating activities | 419.7 | 301.5 | 159.4 | –45.8 | |
Investments | 294.3 | 198.3 | 177.6 | 250.0 | 48.4 |
Free cash flow | 124.5 | 113.4 | –15.4 | –273.5 |
|
Equity | 1,851.1 | 1,786.7 | 1,765.7 | 1,815.2 | 3.6 |
Equity ratio in % | 33.0 | 31.5 | 32.2 | 33.0 |
|
Net Debt/EBITDA | 7.4 | 9.4 | 12.7 | –64.3 |
|
ROCE = EBIT / (equity + net debt + ongoing employee benefits)
Share of the Airport’s procurement volume
Worldwide = 100%
Change in %
2024 | 2023 | 2022 | 2021 | 2024/23 | |
|---|---|---|---|---|---|
Germany | 96 | 96 | 94 | 96 | 0 |
Bavaria | 69 | 65 | 62 | 53 | 6.2 |
Munich and the Airport area | 43 | 39 | 39 | 33 | 10.3 |
Environmental and climate protection
CO₂ emissions
In tonnes
Change in %
| 2024 | 2023 | 2022 | 2021 | 2024/23 |
|---|---|---|---|---|---|
Direct emissions Scope 1 | 87,430 | 83,686 | 81,613 | 73,075 | 4.5 |
Indirect emissions Scope 2 | 7,584 | 6,806 | 8,739 | 5,265 | 11.4 |
Attributable CO₂ emissions | 95,014 | 90,492 | 90,352 | 78,340 | 4.9 |
Specific CO₂ emissions
In Kilograms
Change in %
| 2024 | 2023 | 2022 | 2021 | 2024/23 |
|---|---|---|---|---|---|
CO₂ emissions per passenger | 2.29 | 2.44 | 2.85 | 6.27 | −6.1 |
Drinking water and wastewater
In cubic meters
Change in %
| 2024 | 2023 | 2022 | 2021 | 2024/23 |
|---|---|---|---|---|---|
Volume of purchased drinking water | 937,339 | 891,705 | 811,648 | 562,510 | 5.1 |
Drinking water consumption per 1,000 TU1) | 21.0 | 22.4 | 23.7 | 39.6 | −6.3 |
Total wastewater discharged | 2,689,058 | 2,387,073 | 2,051,259 | 1,955,165 | 12.7 |
Wastewater per 1,000 TU1) | 60.2 | 59.9 | 59.8 | 137.6 | 0.5 |
traffic units
Employees and society
Employee structure1)
Number
Change in %
| 2024 | 2023 | 2022 | 2021 | 2024/23 |
|---|---|---|---|---|---|
Total | 9,059 | 8,362 | 8,610 | 8,693 | 8.3 |
Women in % | 29.74 | 31.37 | 32.04 | 32.21 | −5.2 |
Men in % | 70.26 | 68.63 | 67.96 | 67.79 | 2.4 |
Full-time in % | 81.06 | 80.97 | 77.53 | 78.82 | 0.1 |
Part-time in % | 18.94 | 19.03 | 22.47 | 21.18 | −0.5 |
< 30 years in % | 15.58 | 13.45 | 11.58 | 10.96 | 15.8 |
30–50 years in % | 48.85 | 48.49 | 50.09 | 51.07 | 0.7 |
> 50 years in % | 35.58 | 38.05 | 38.33 | 37.97 | −6.5 |
Reporting date: December 31: Figures exclude apprentices, workers in minor employment, temporary
workers, and interns.
Apprentices
Number
Change in %
| 2024 | 2023 | 2022 | 2021 | 2024/23 |
|---|---|---|---|---|---|
Total | 275 | 236 | 230 | 247 | 16.5 |
Donations and sponsorship
Proportion of total budget in %
Change in %
2024 | 2023 | 2022 | 2021 | 2024/23 | |
|---|---|---|---|---|---|
Sport | 34 | 55 | 77 | 60 | −38.2 |
Culture | 32 | 32 | 17 | 7 | 0 |
Social welfare | 17 | 8 | 4 | 18 | 112.5 |
Environment | 13 | 0 | 0 | 2 | |
Education | 4 | 6 | 2 | 13 | −33.3 |
Operational
PAssengers
In millions
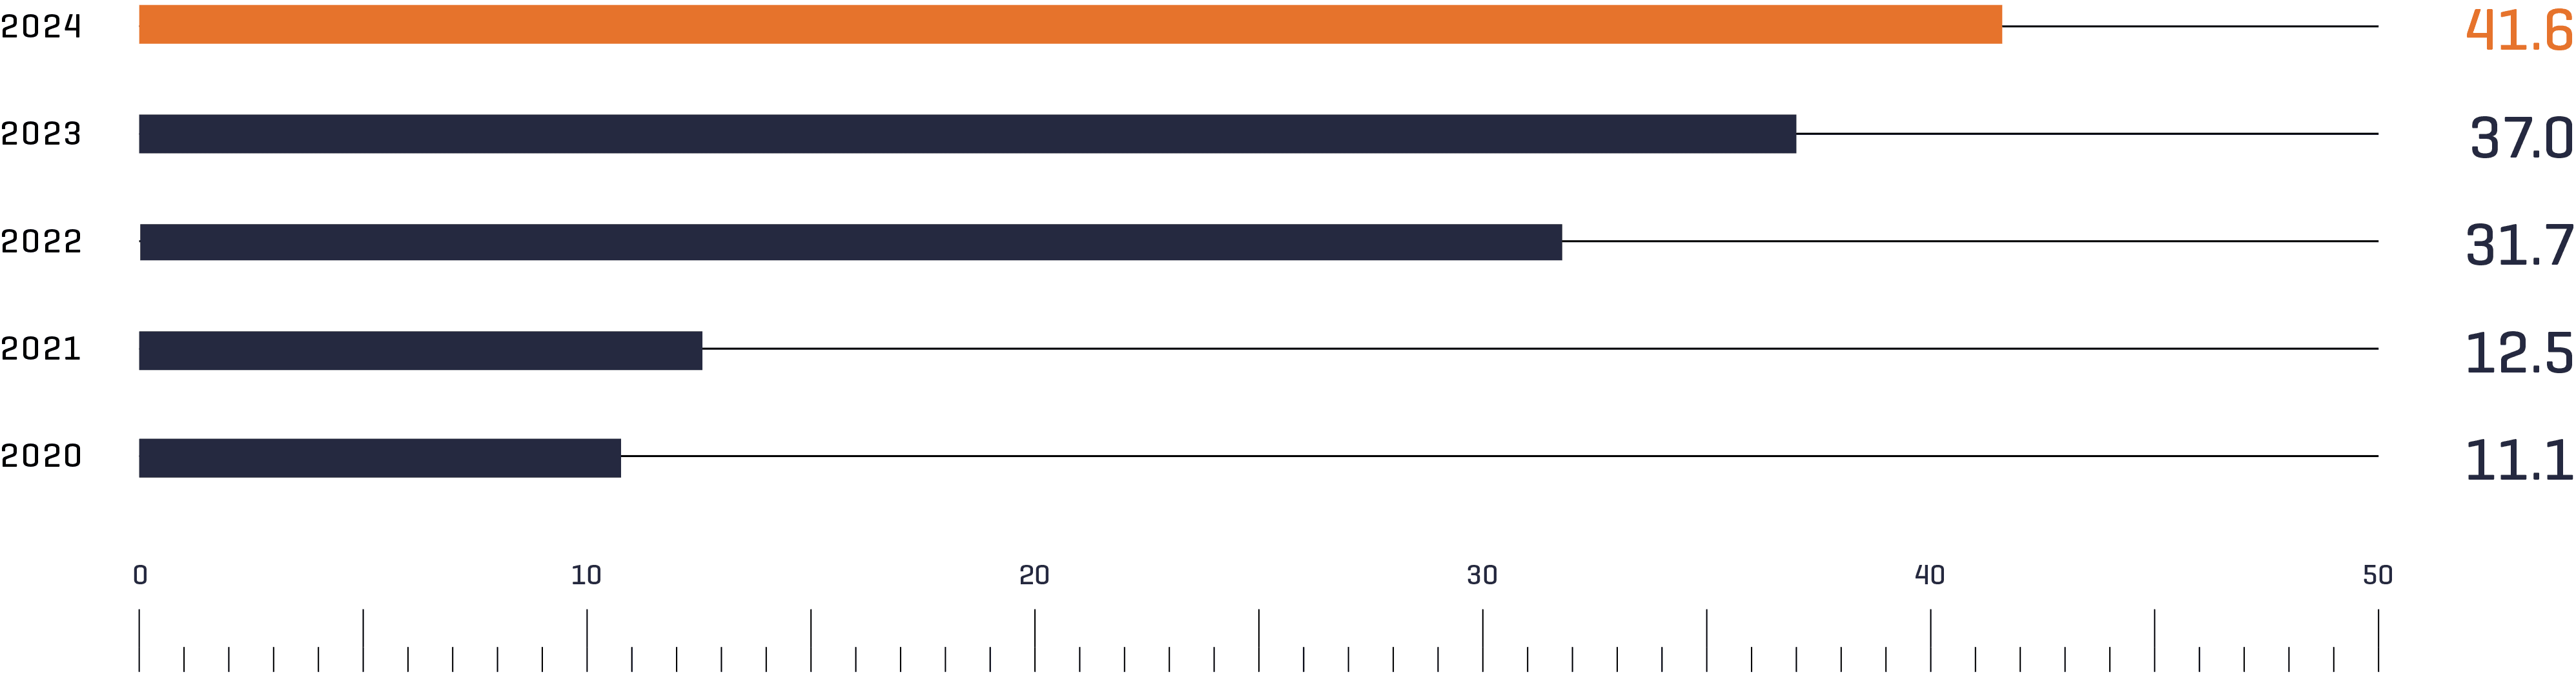
With 41.6 million passengers, Munich Airport achieved double-digit passenger growth in 2024.
This made the Bavarian air traffic hub the fastest-growing airport in Germany in 2024.
Aircraft movements
In thousands
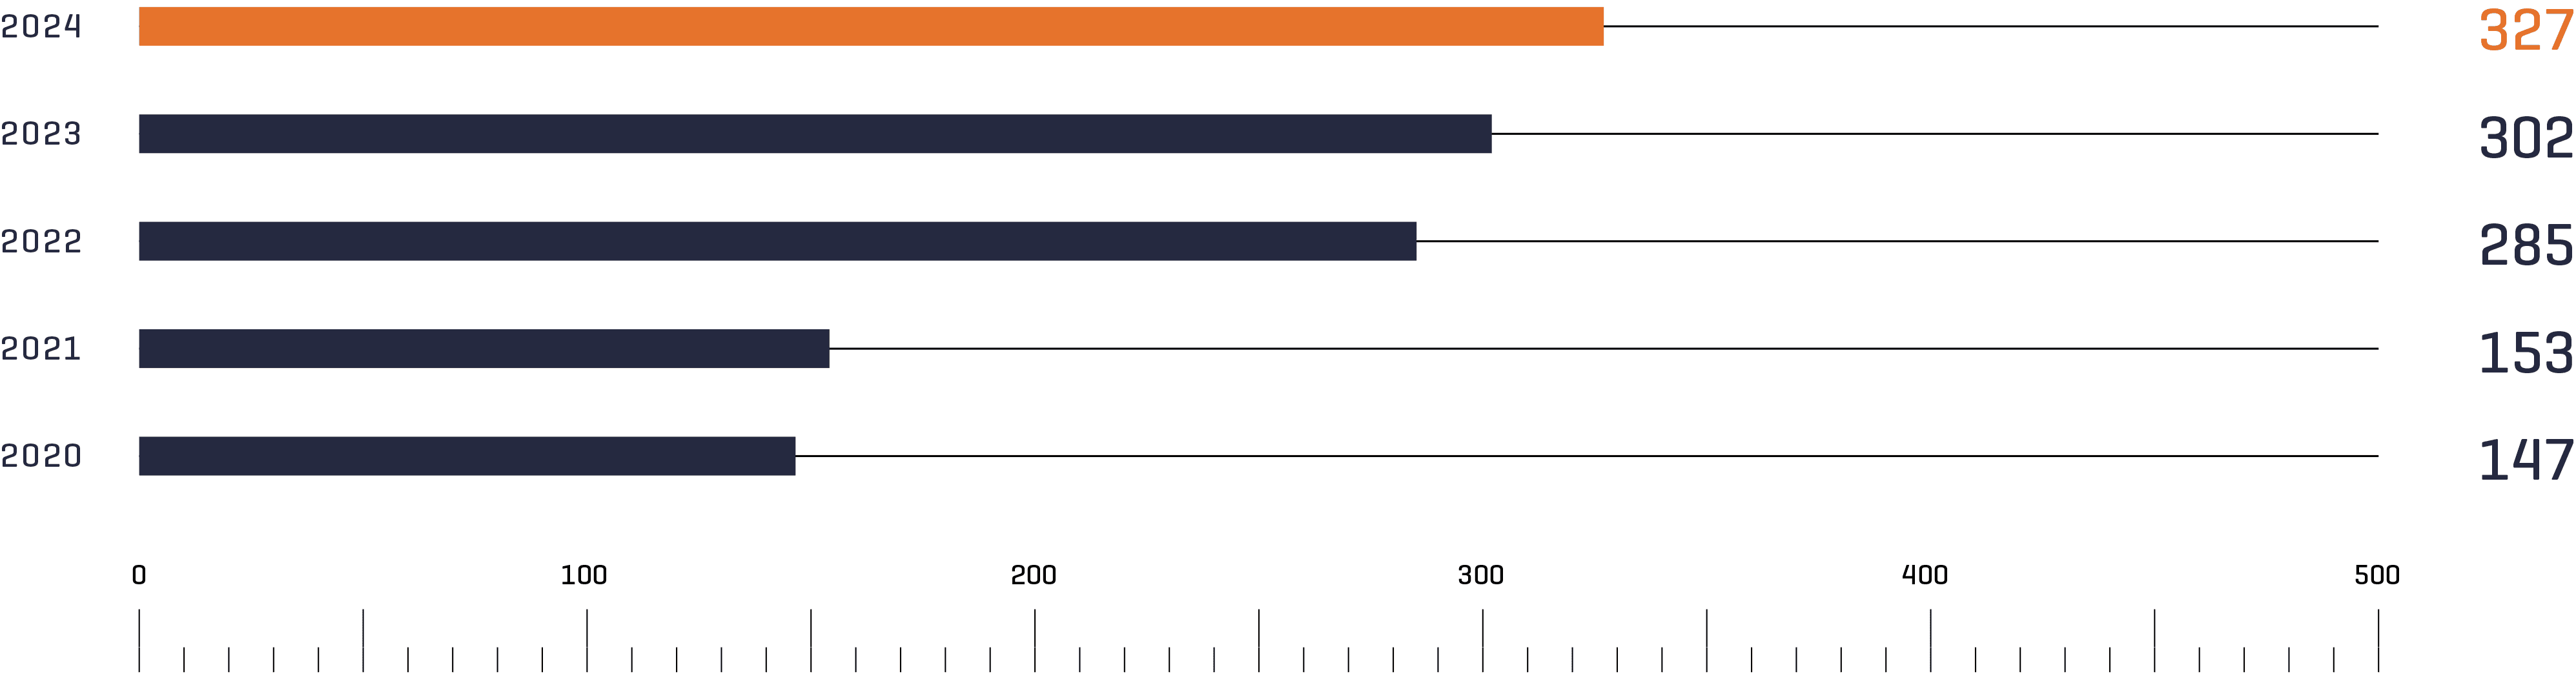
The number of take-offs and landings was eight percent higher than in 2023.
At around 82 percent, the seat occupancy rate once again exceeded the record result from 2023.
Management-related
Munich Airport has defined four key performance indicators to measure the development of the company. These key performance indicators are a measure of doing business in a sustainable and integrated manner and influence the variable remuneration components for managers.
CONSOLIDATED EARNINGS BEFORE TAXES (EBT)
€ million
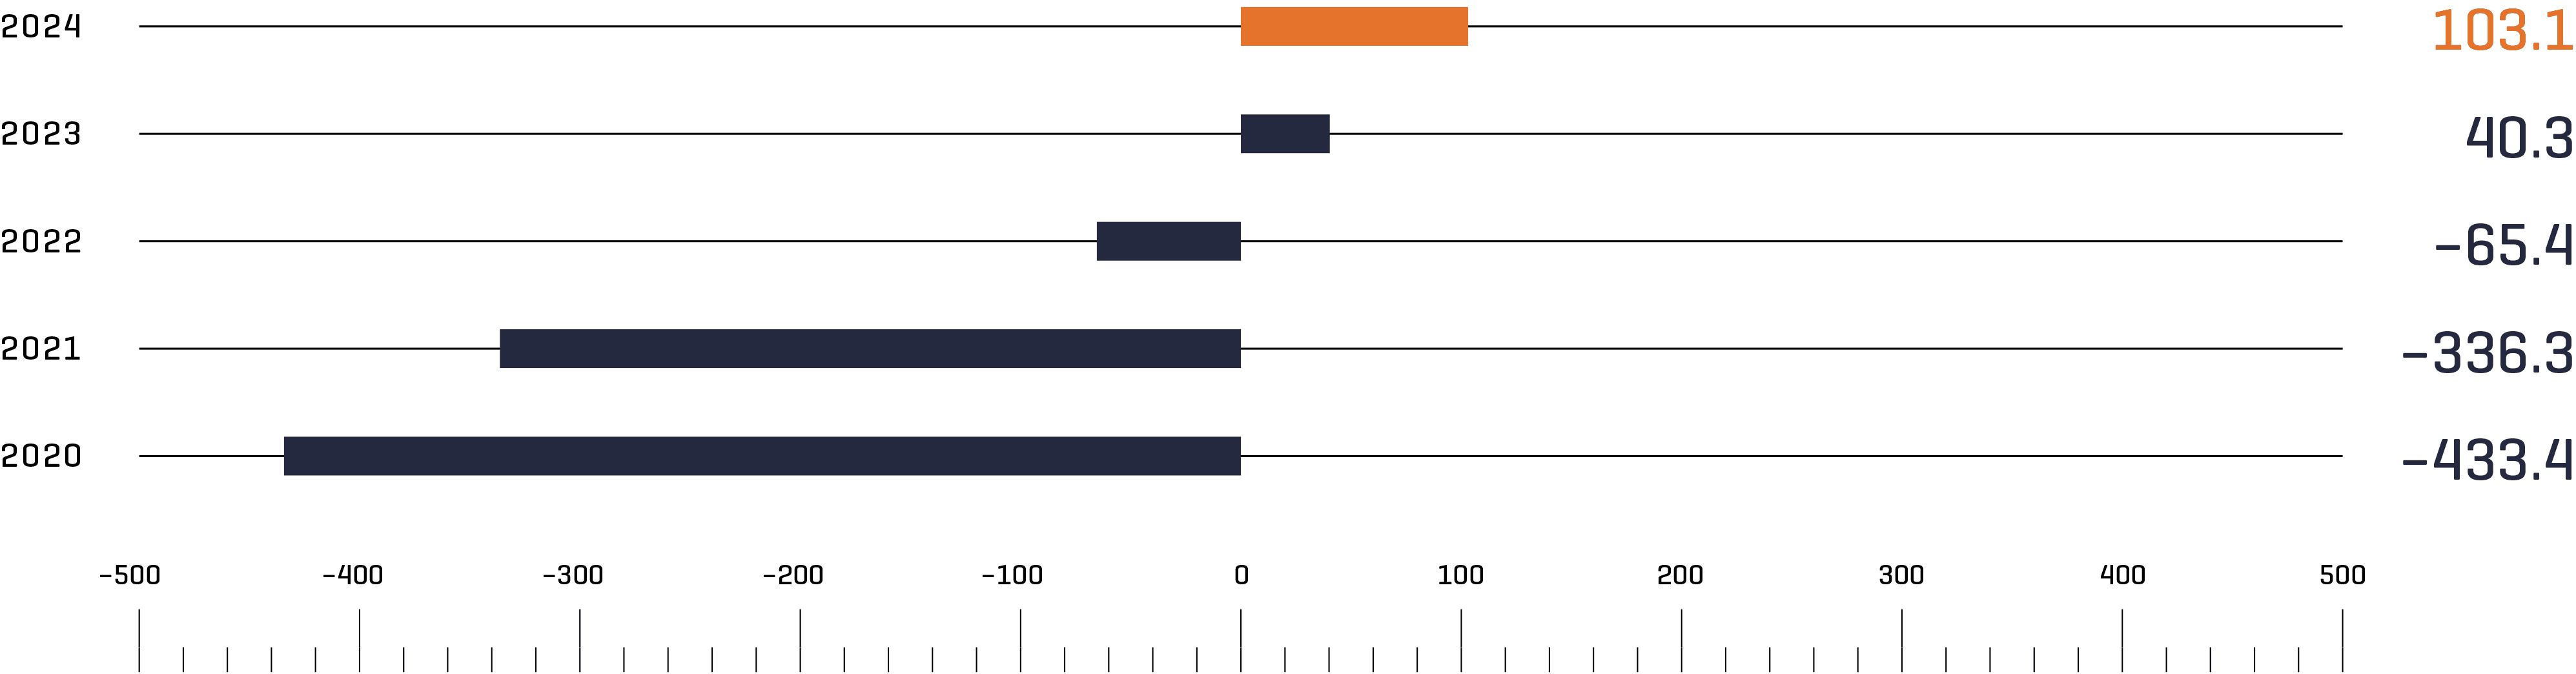
Munich Airport’s EBT for the 2024 fiscal year significantly exceeded the planned figure.
This was mainly thanks to the substantial recovery in traffic volume.
Carbon REDUCTIONS1)
In Tonnes
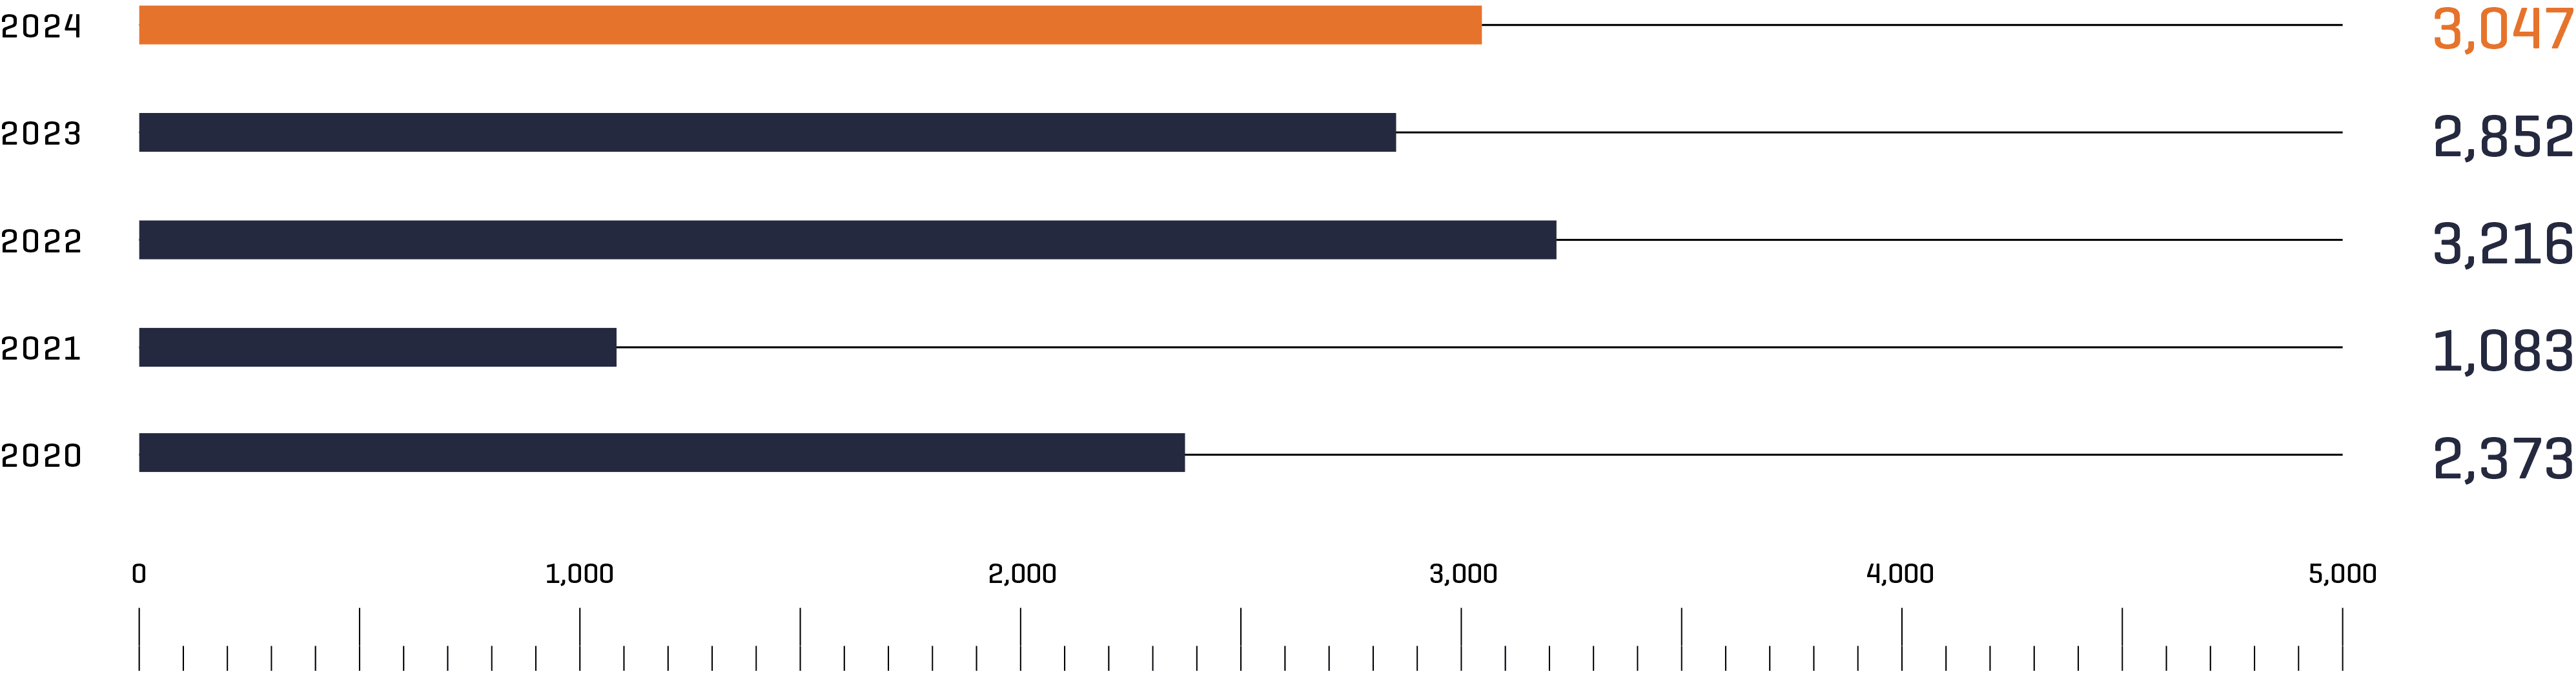
The average consumption values from 2017 are used to calculate the carbon reductions that are generated from the replacement of vehicle types.
The efficiency measures that were completed in 2024 produced savings of 3,047 tonnes of CO₂, thus exceeding the target that was set.
LoST TIME INCIDENT FREQUENCY RATE (LTIF)1)
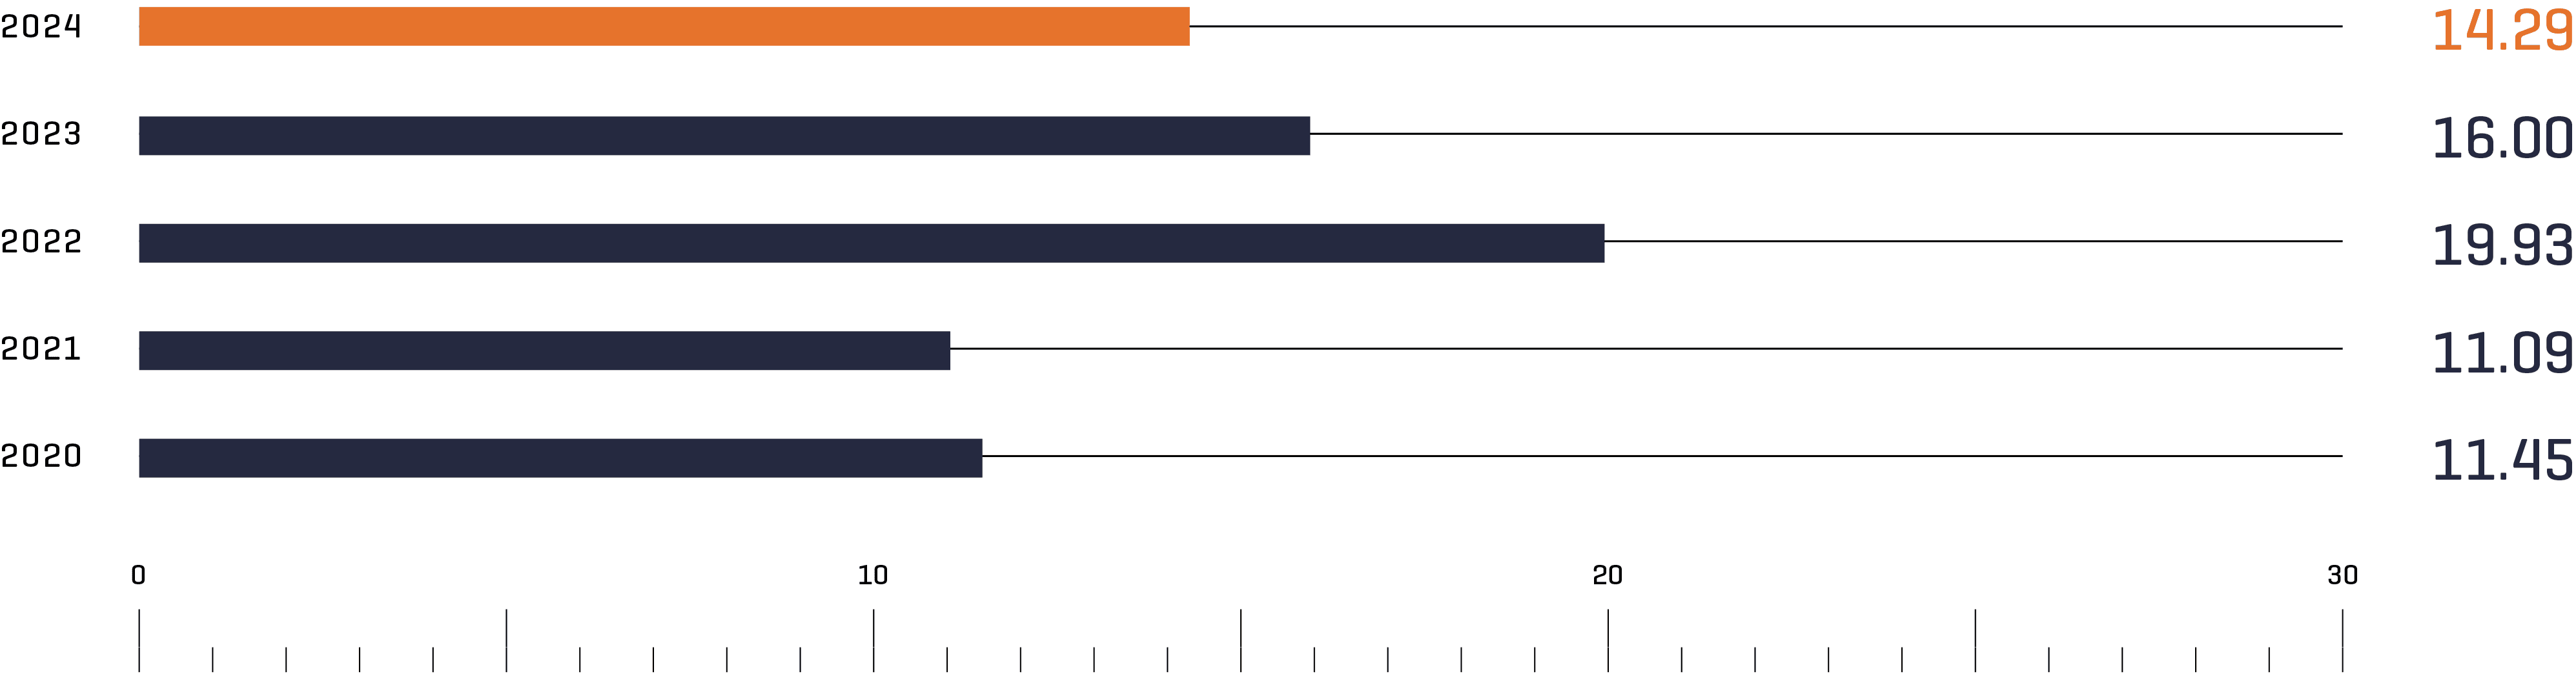
Applies to FMG and AE Munich.
In 2024, the LTIF for FMG and AE Munich was 14.29, which greatly exceeded the forecast value.
This decline is due to the slight reduction in occupational accidents accompanied by a sharp increase in hours worked at the same time.
PASSENGER EXPERIENCE INDEX (PEI)1)
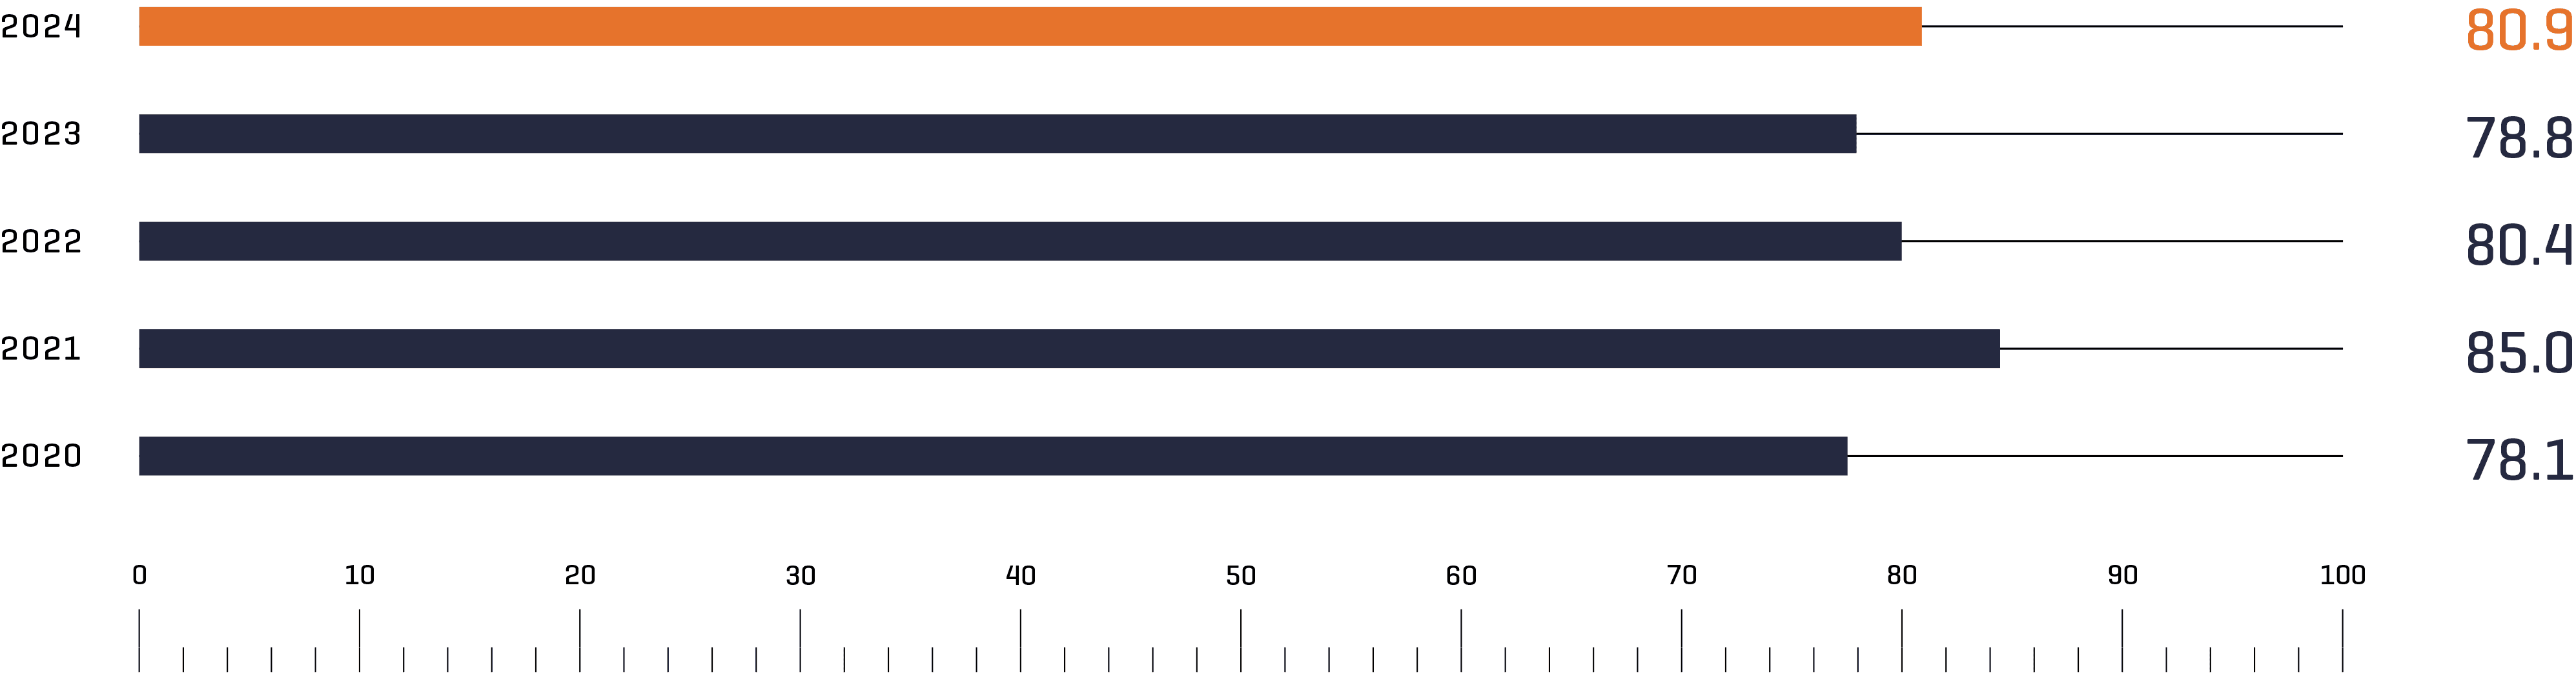
The value refers to the question about overall satisfaction.
Munich Airport recorded a considerable increase in passenger satisfaction as measured by the PEI in 2024.
This can be attributed in particular to the ongoing optimization of passenger processes.